BASIC INFORMATION
| Eruption onset date | Nov. 8.2019 |
|---|---|
| Eruption onset time (LST) | 17:24 |
| Eruption column top (m) | 5500 |
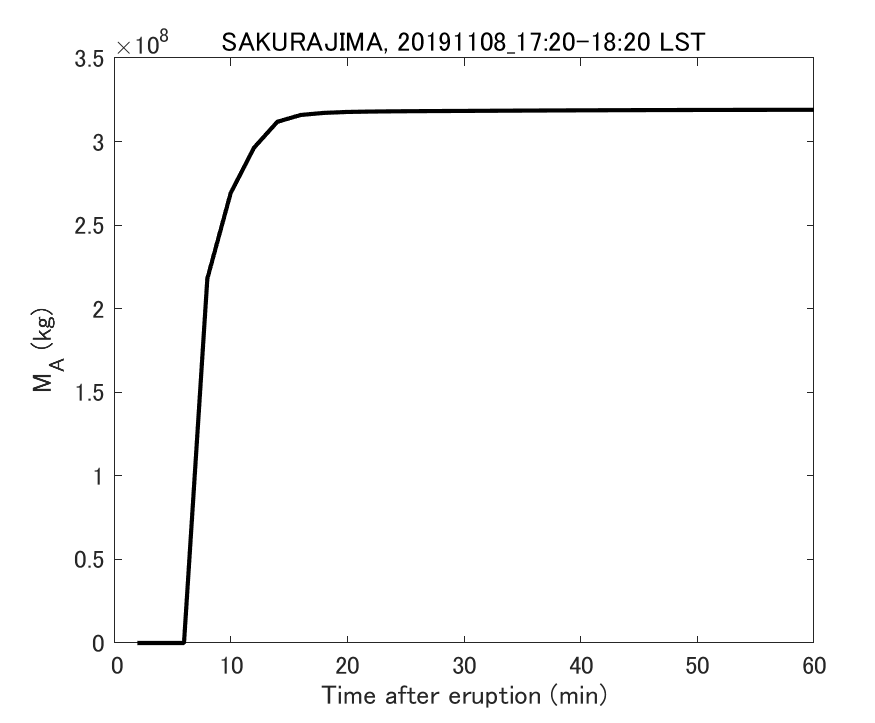
| Total ashfall amount (kg) | 5.09E+07 |
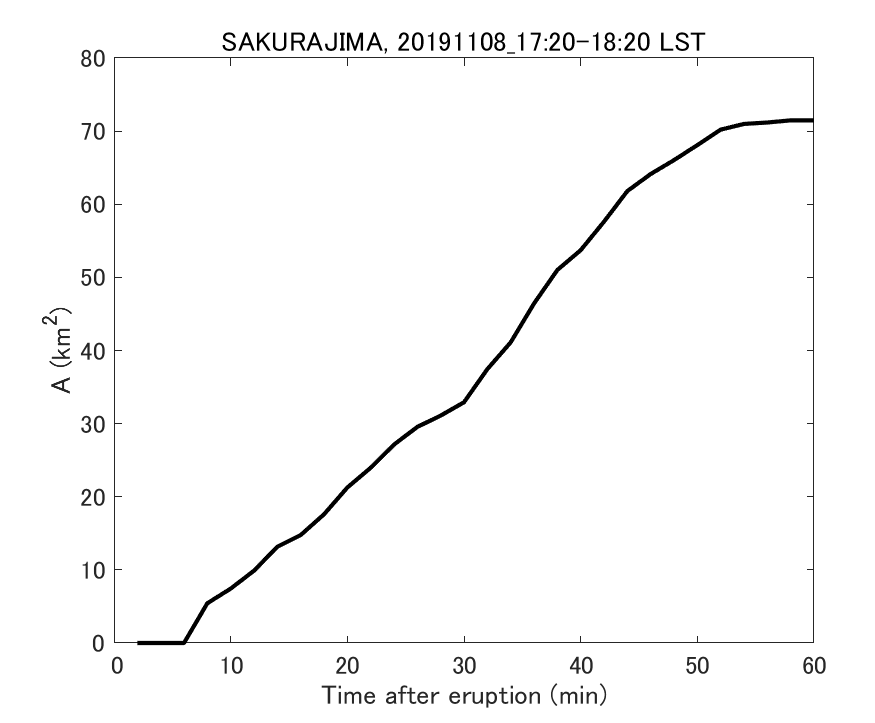
| Total ashfall area (km2) | 69.7 |
SPECIFIC INFORMATION
PHOTO
Fig. 1-1 Photo from Tarumizu, Kagoshima (courtesy of Dr.Iino ,Kumamoto Univ.).
Fig. 1-2 Photo from Kinkodai, Kagoshima (courtesy of Dr. Iino,Kumamoto Univ.).
TRM-XMP Radar (MLIT)
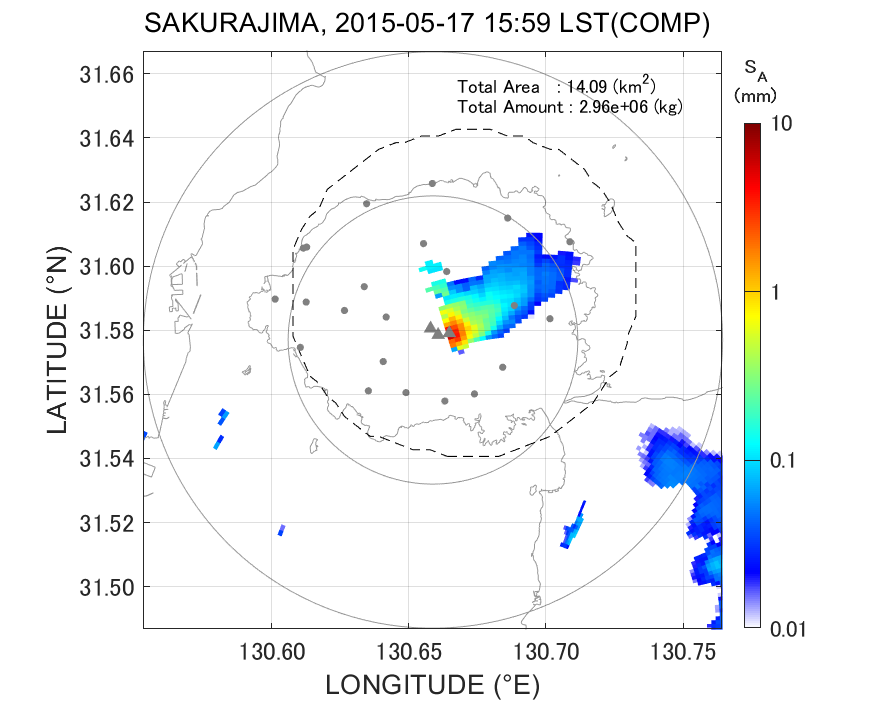
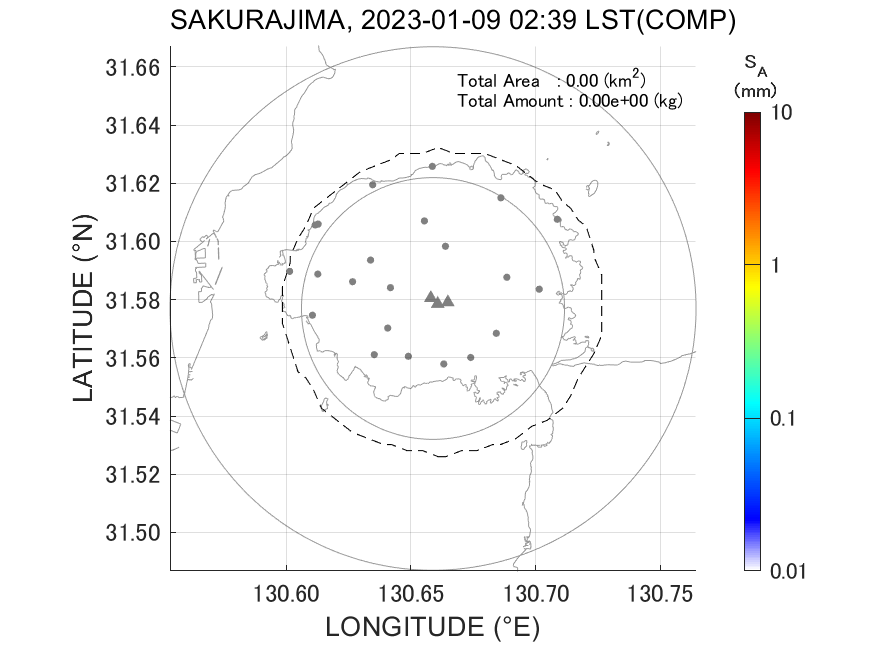
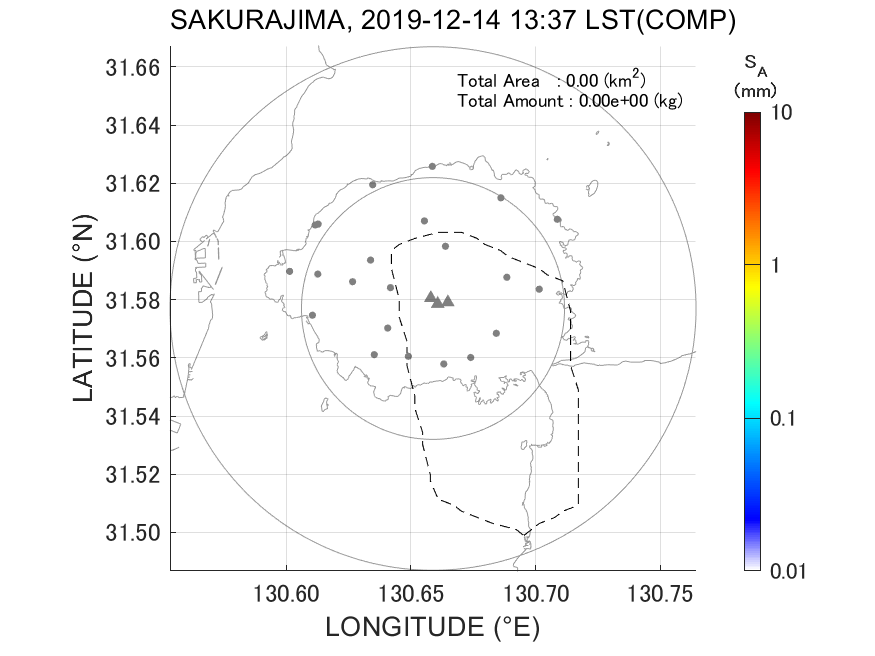
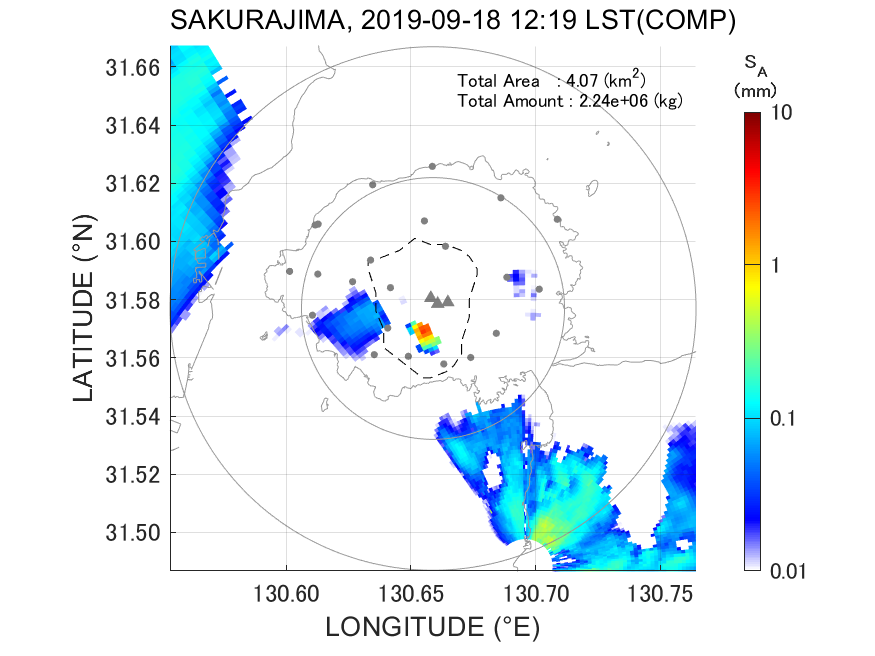
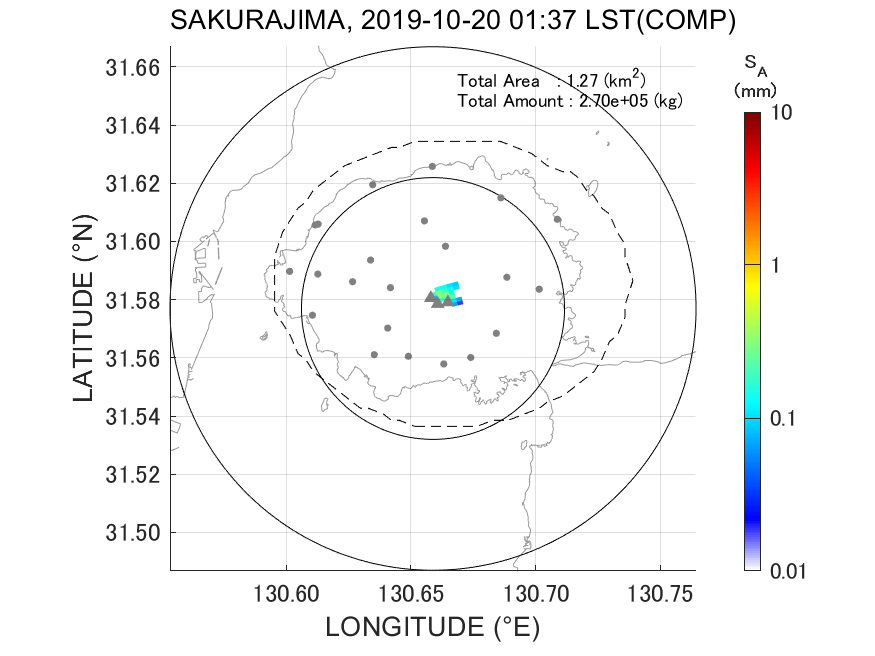
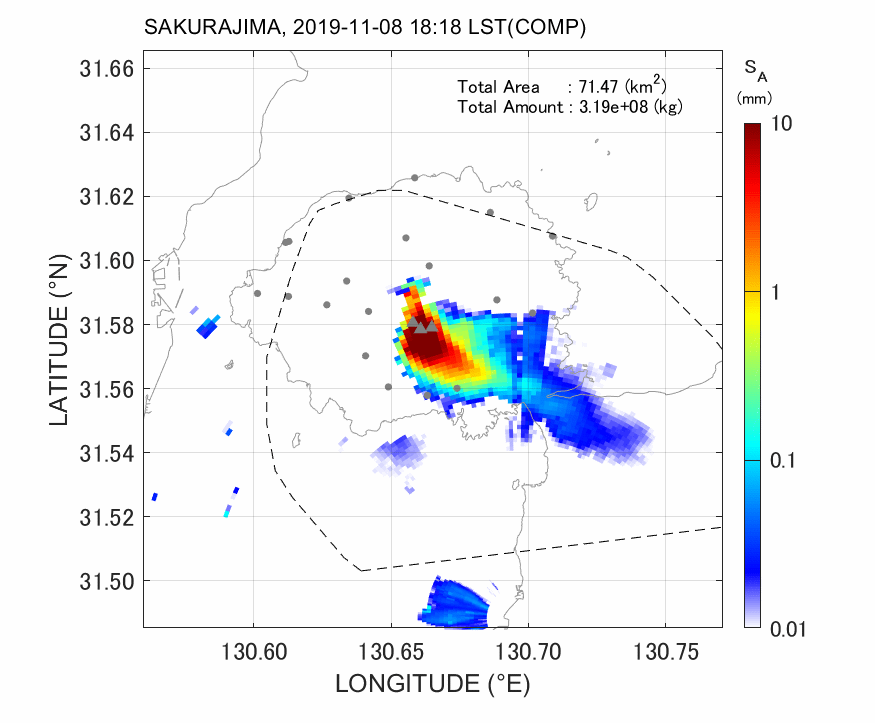
Fig. 2-1 Accumulated ash fall distribution (animation).
Fig. 2-2 Ash fall duration time (animation).
SVO-XMP Radar (DPRI)
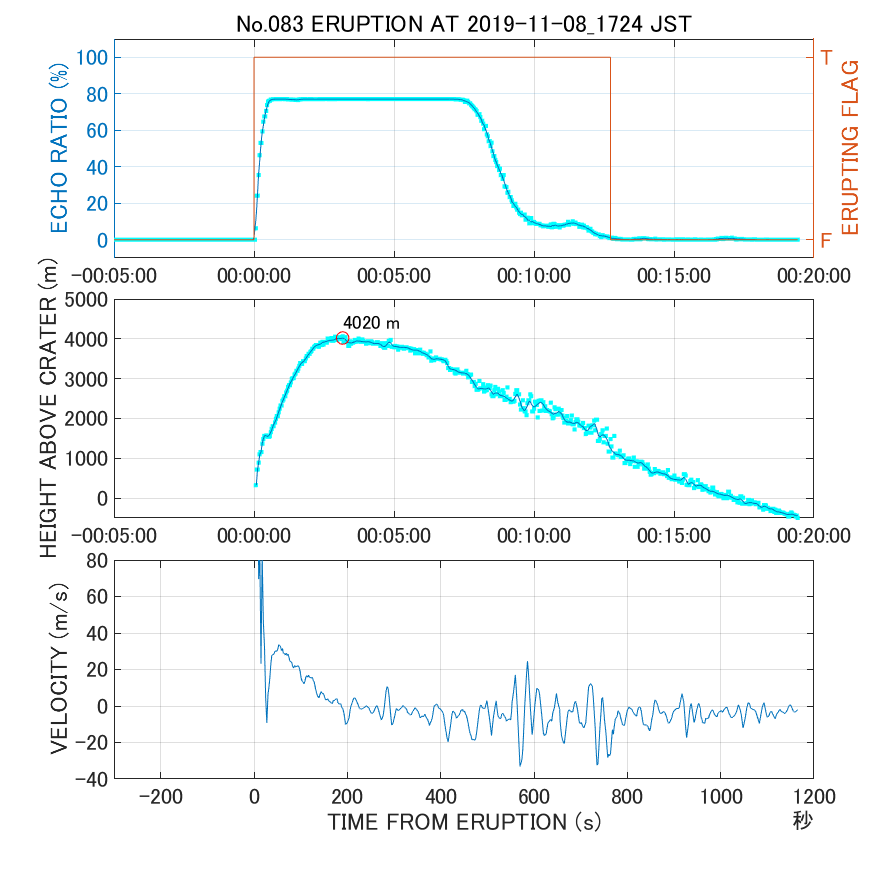
Fig. 4-1 Temporal change of the eruption column. (Top view)
Fig. 4-2 Temporal change of the eruption column. (Bird’s eye view)
Fig. 4-3 RHI images of radar reflectivity factor ZH (animation).
Fig. 4-4 RHI images of Doppler velocity VD(animation).
Marine Radar (Kagoshima Univ. et al.)
Fig. 5-1 Development of eruption column.
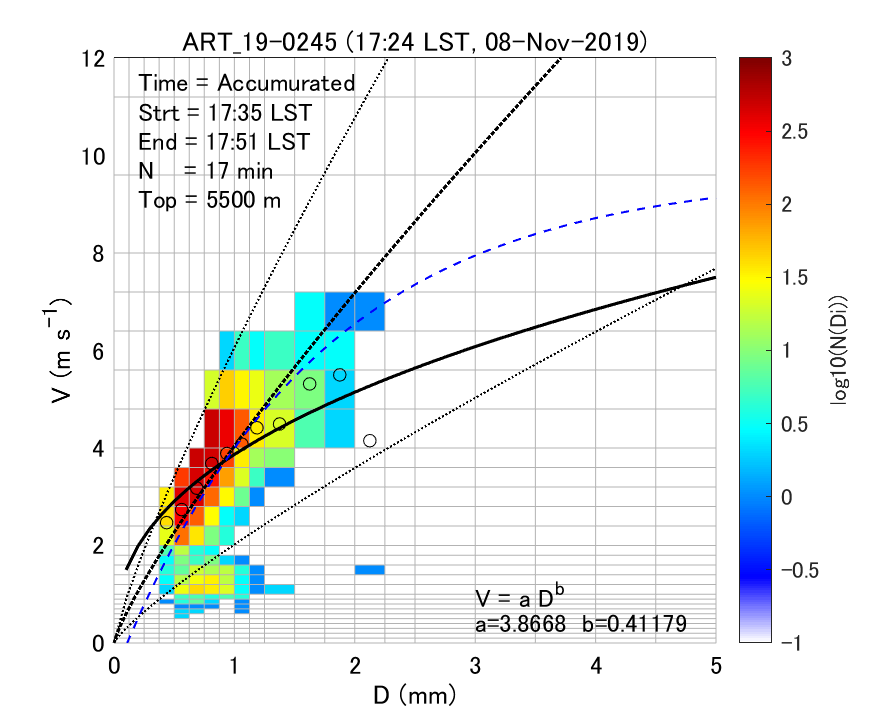
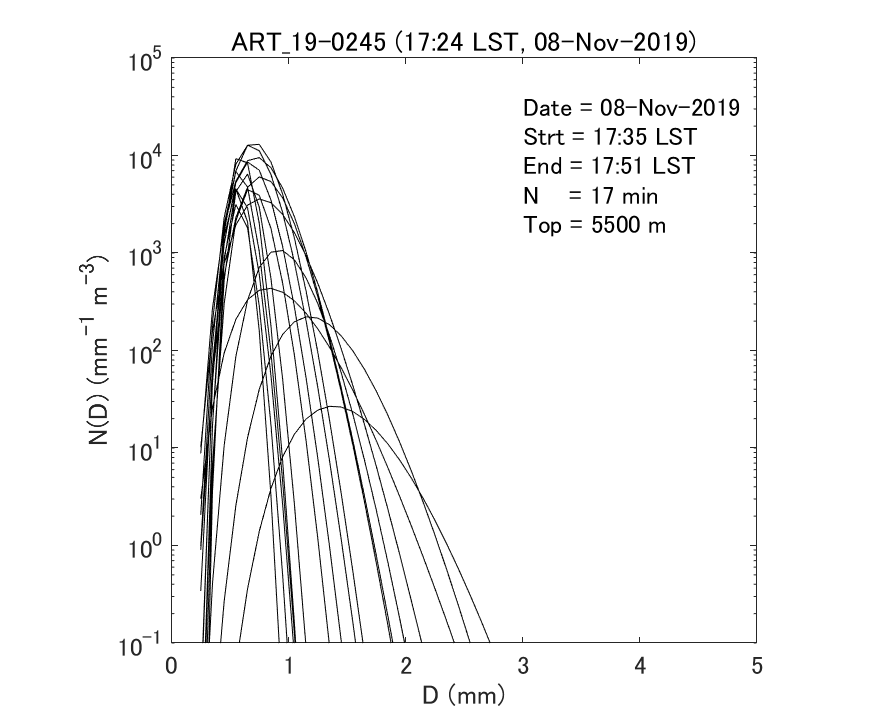
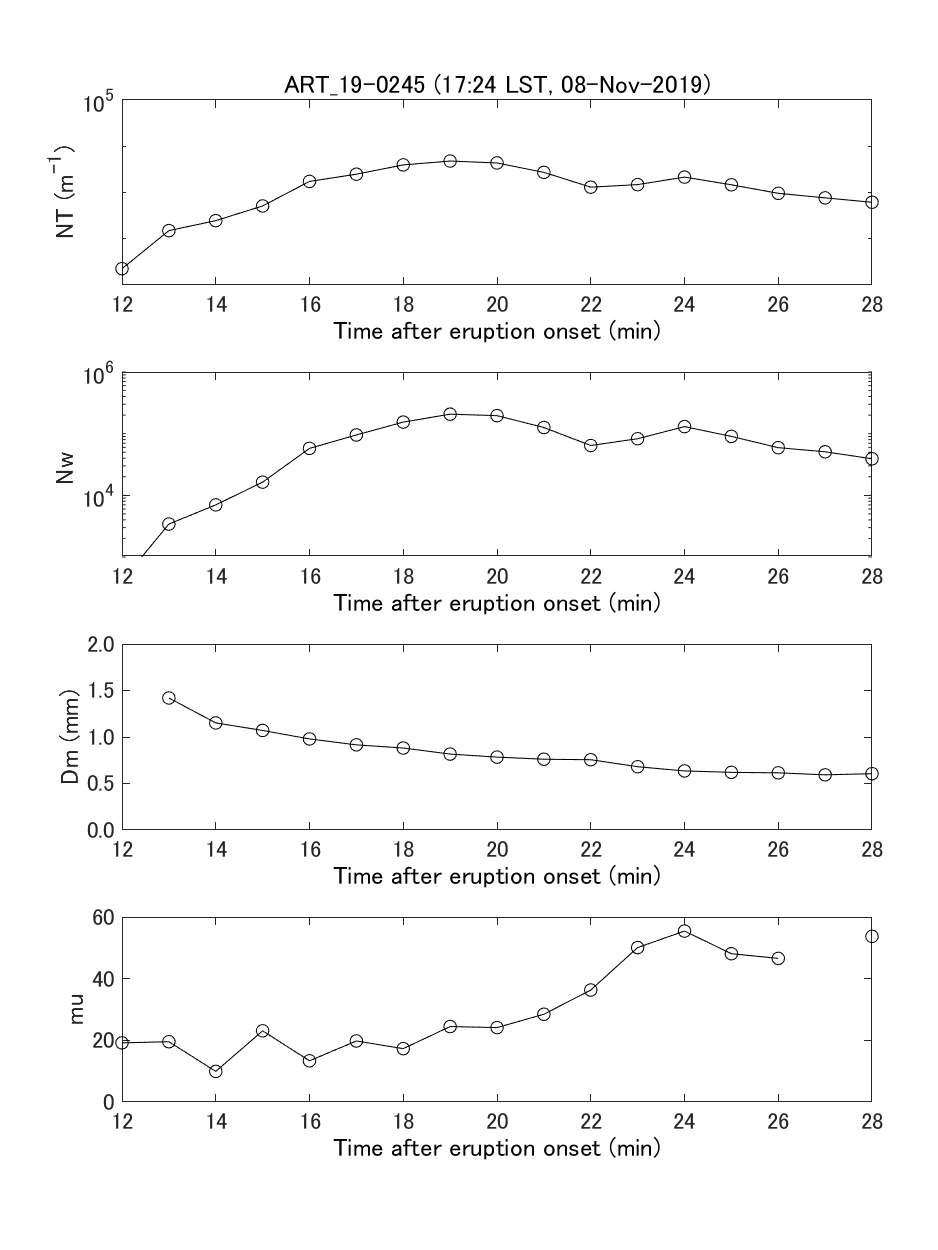
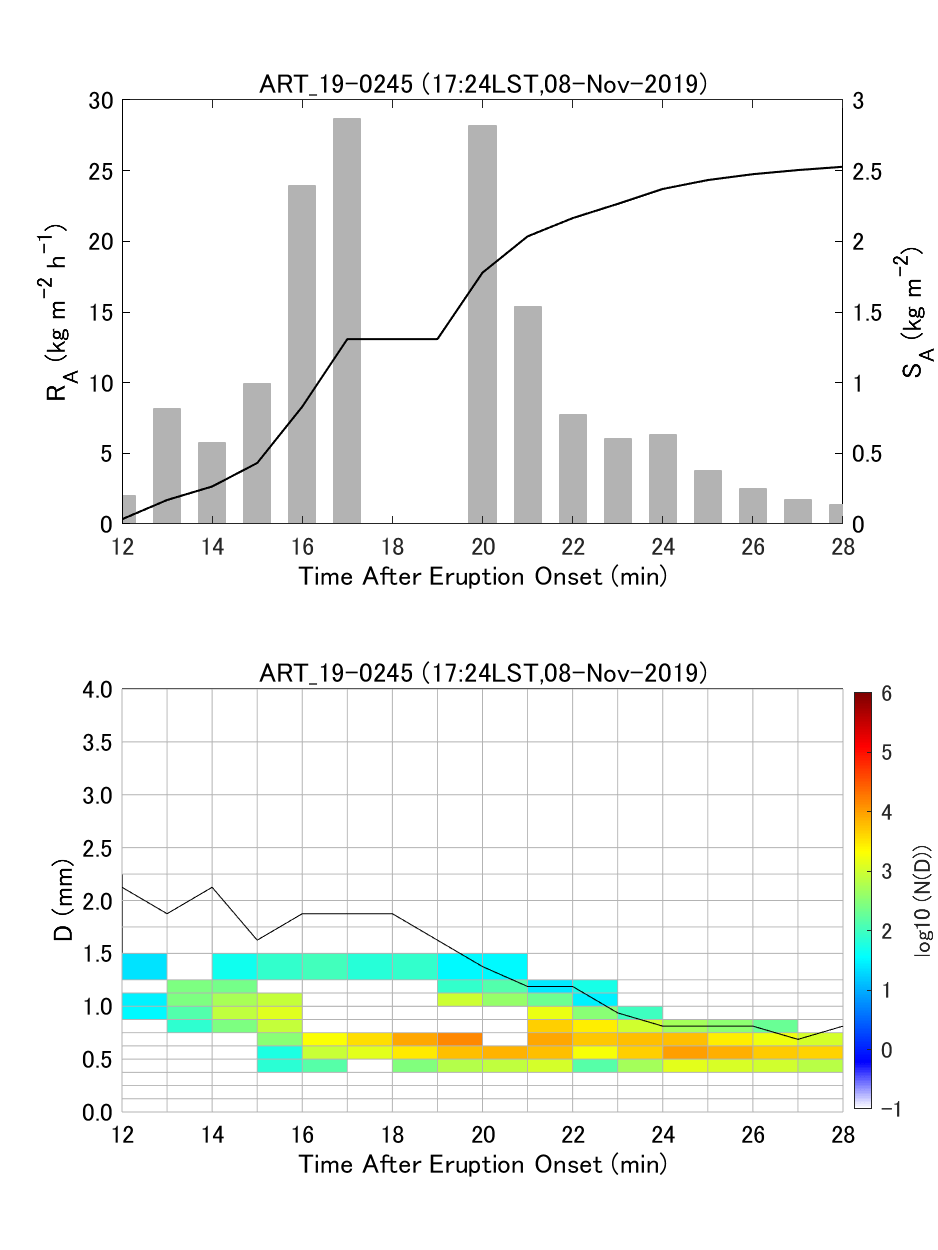
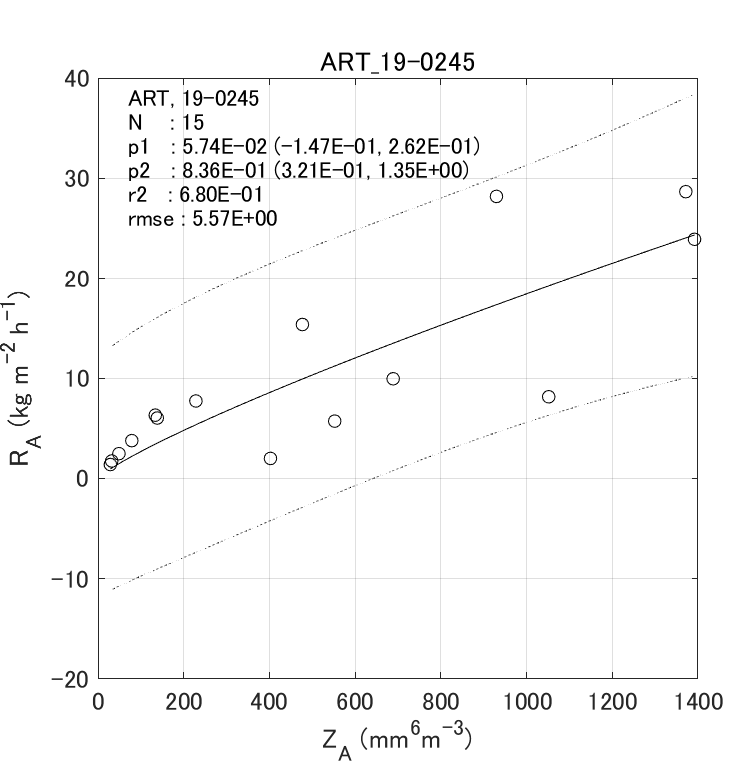
DISDROMETER (DPRI)
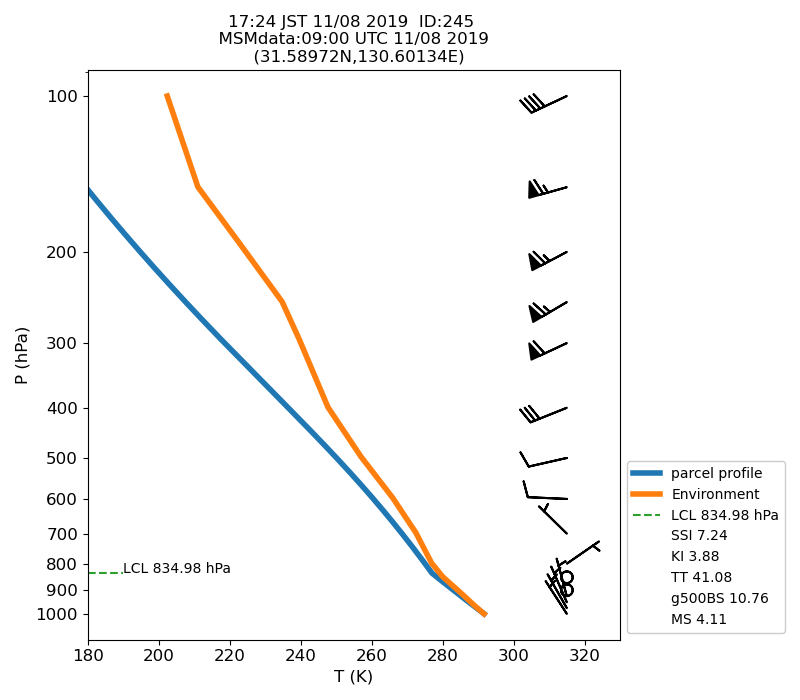
Meteorological Information