BASIC INFORMATION
Eruption onset date | Nov. 6.2019 |
---|---|
Eruption onset time (LST) | 15:38 |
Eruption column top (m) | 3000 |
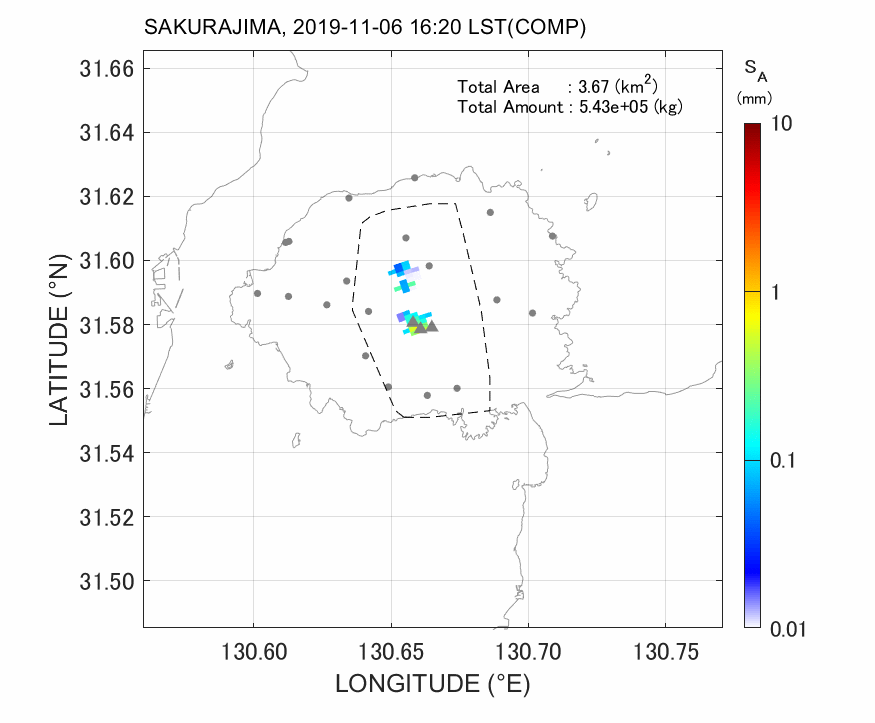
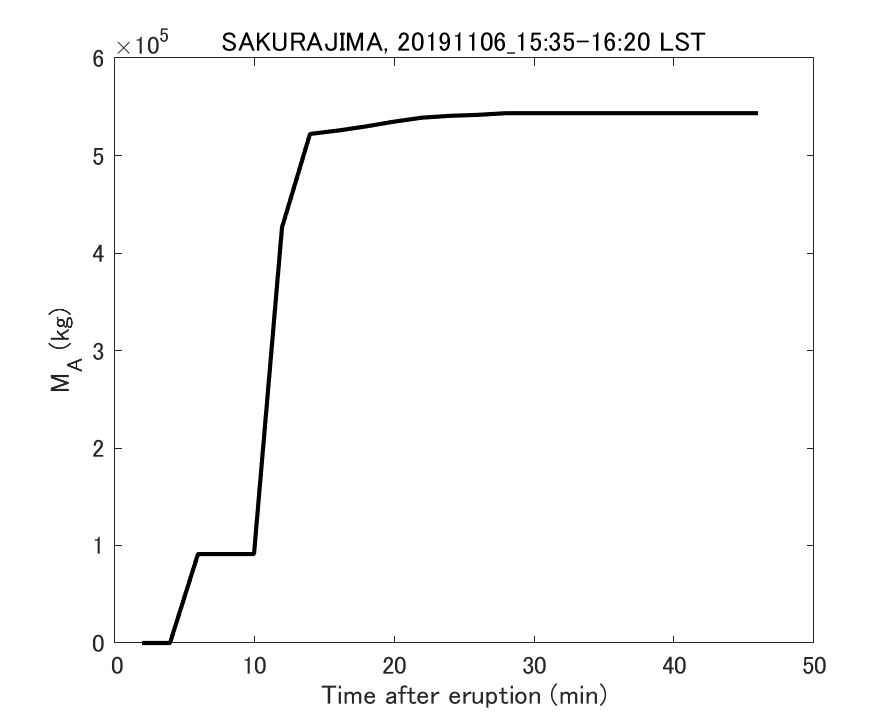
Total ashfall amount (kg) | 5.43E+06 |
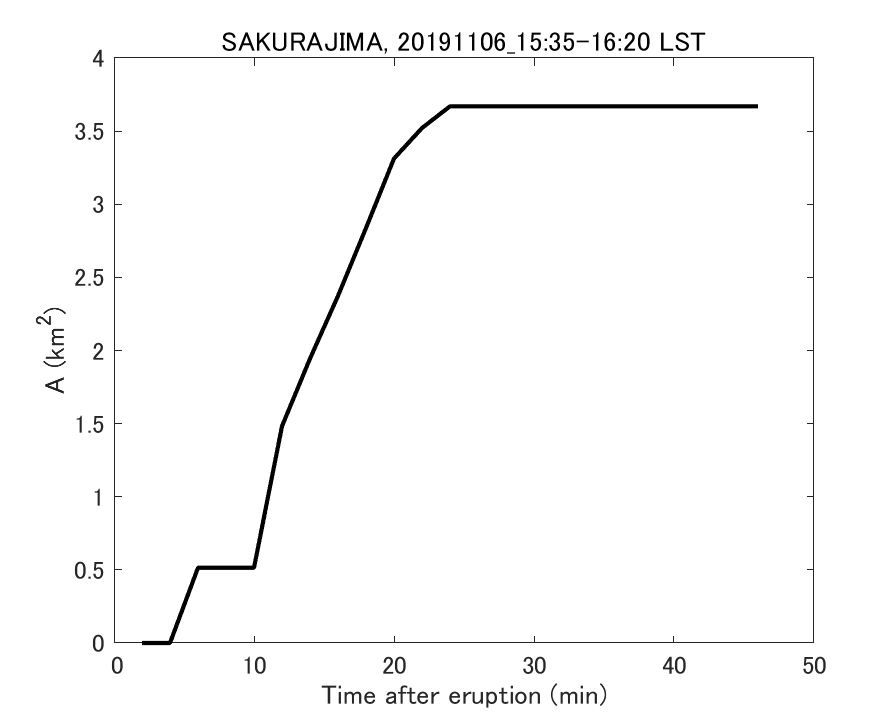
Total ashfall area (km2) | 3.67 |
SPECIFIC INFORMATION
![BASIC INFORMATION .1](https://vash.jp/wp-content/uploads/2023/03/skr19-0230_xmp_mlit-01.png)
![BASIC INFORMATION .2](https://vash.jp/wp-content/uploads/2023/03/skr19-0230_xmp_mlit-02.png)
PHOTO
Fig. 1-1 Photo from Tarumizu, Kagoshima (courtesy of Dr.Iino ,Kumamoto Univ.).
TRM-XMP Radar (MLIT)
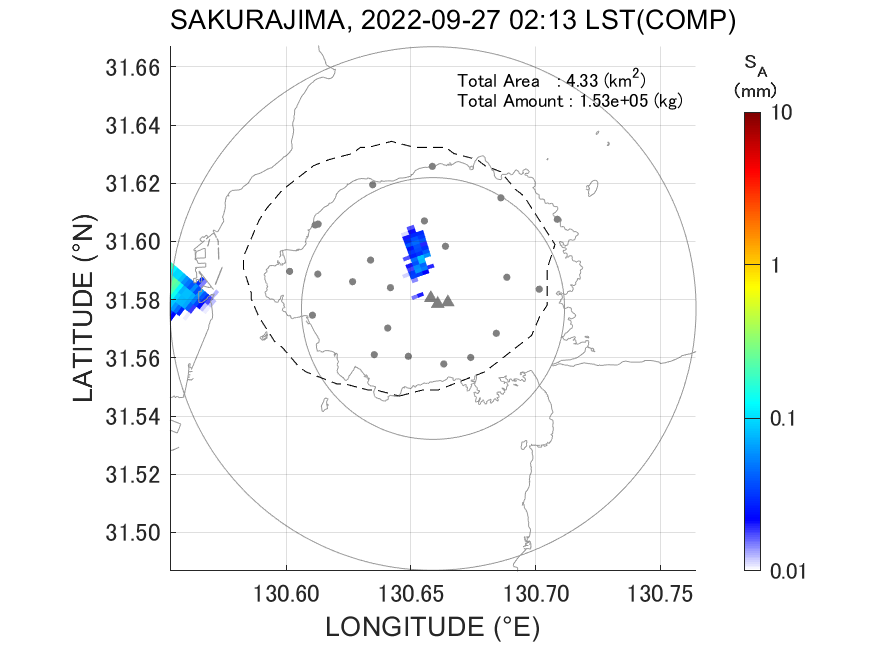
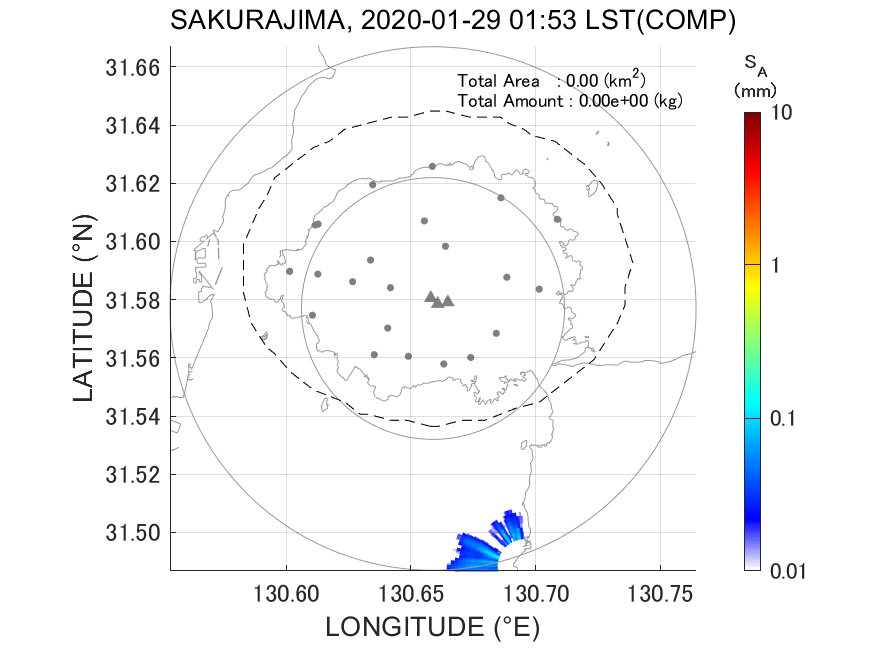
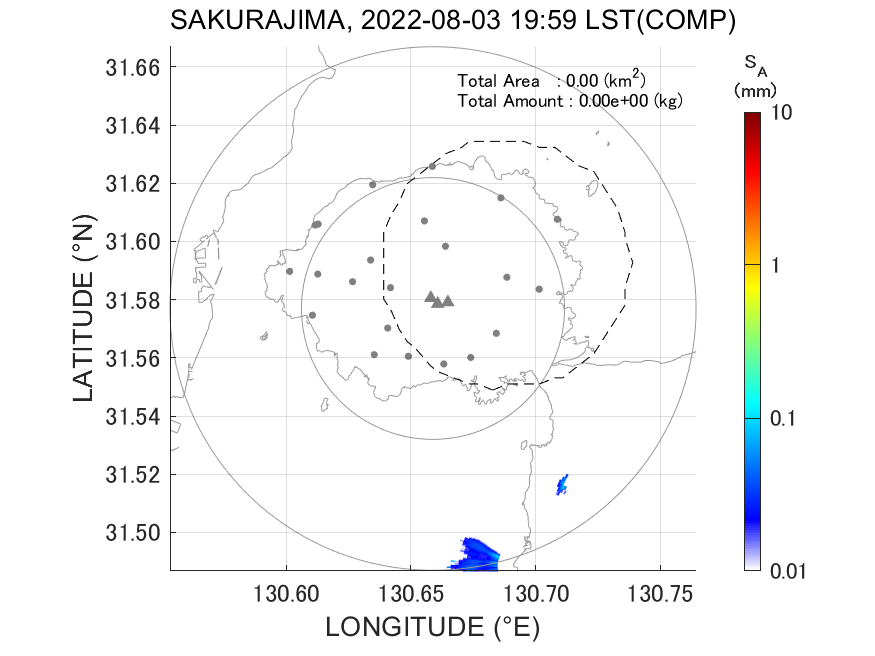
Fig. 2-1 Accumulated ash fall distribution (animation).
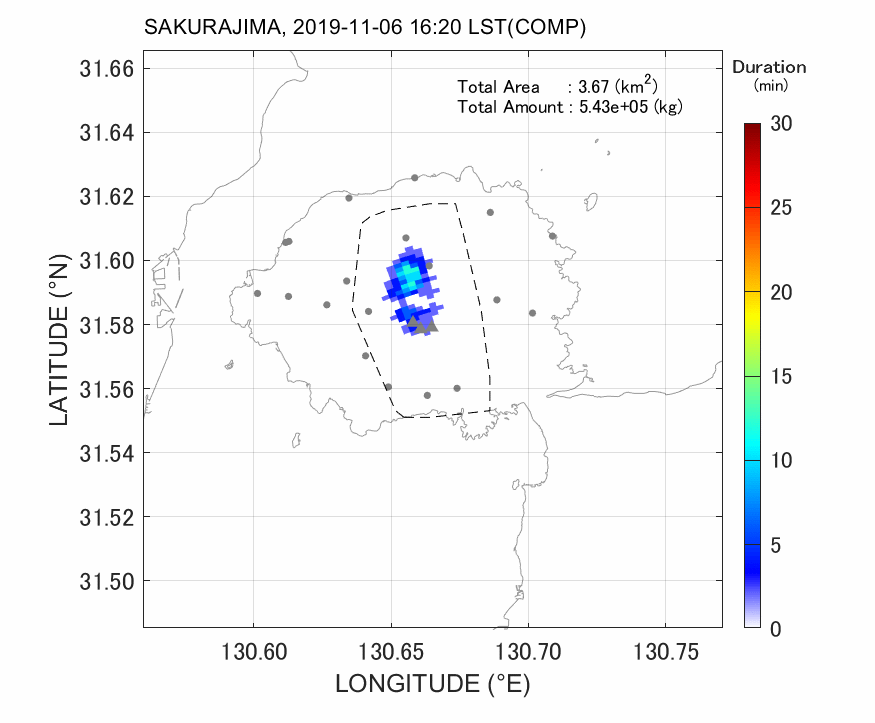
Fig. 2-2 Ash fall duration time (animation).
![Fig. 2-3 Temporal change of total ash fall amount.](https://vash.jp/wp-content/uploads/2023/03/skr19-0230_xmp_mlit-03.png)
![Fig. 2-4 Temporal change of total ash fall area.](https://vash.jp/wp-content/uploads/2023/03/skr19-0230_xmp_mlit-04.png)
SVO-XMP Radar (DPRI)
Fig. 4-3 RHI images of radar reflectivity factor ZH (animation).
Fig. 4-4 RHI images of Doppler velocity VD(animation).
Fig. 4-5 RHI images of differential reflectivity ZDR (animation).
Fig. 4-6 RHI images of specific differential phase KDP(animation).
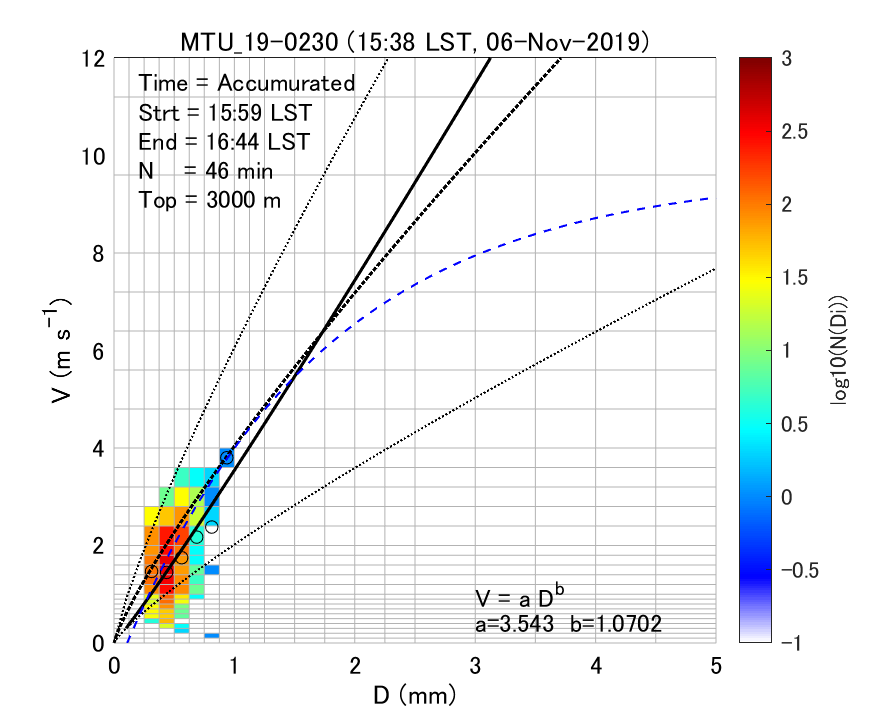
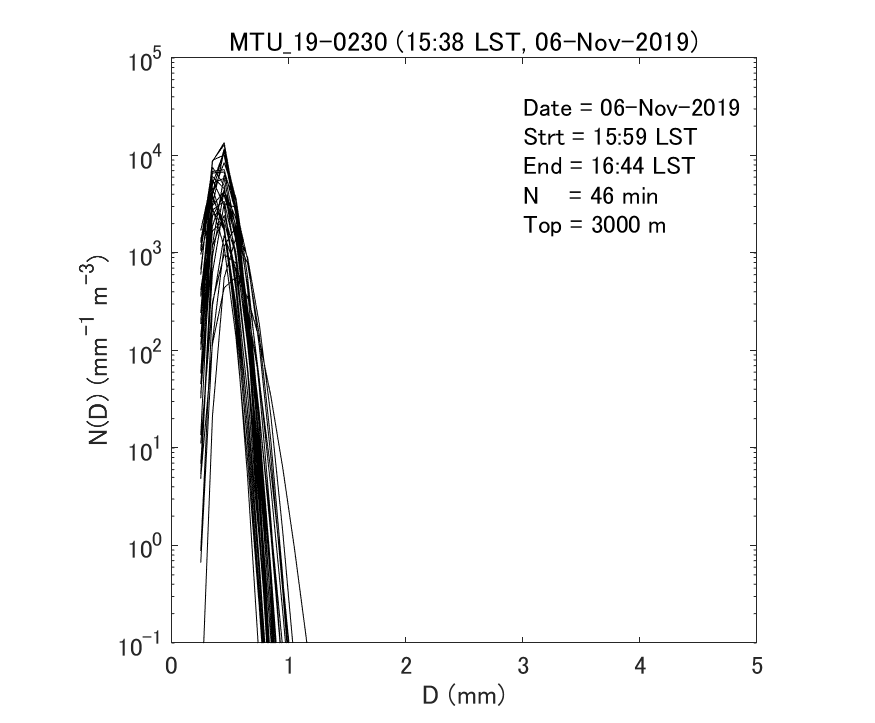
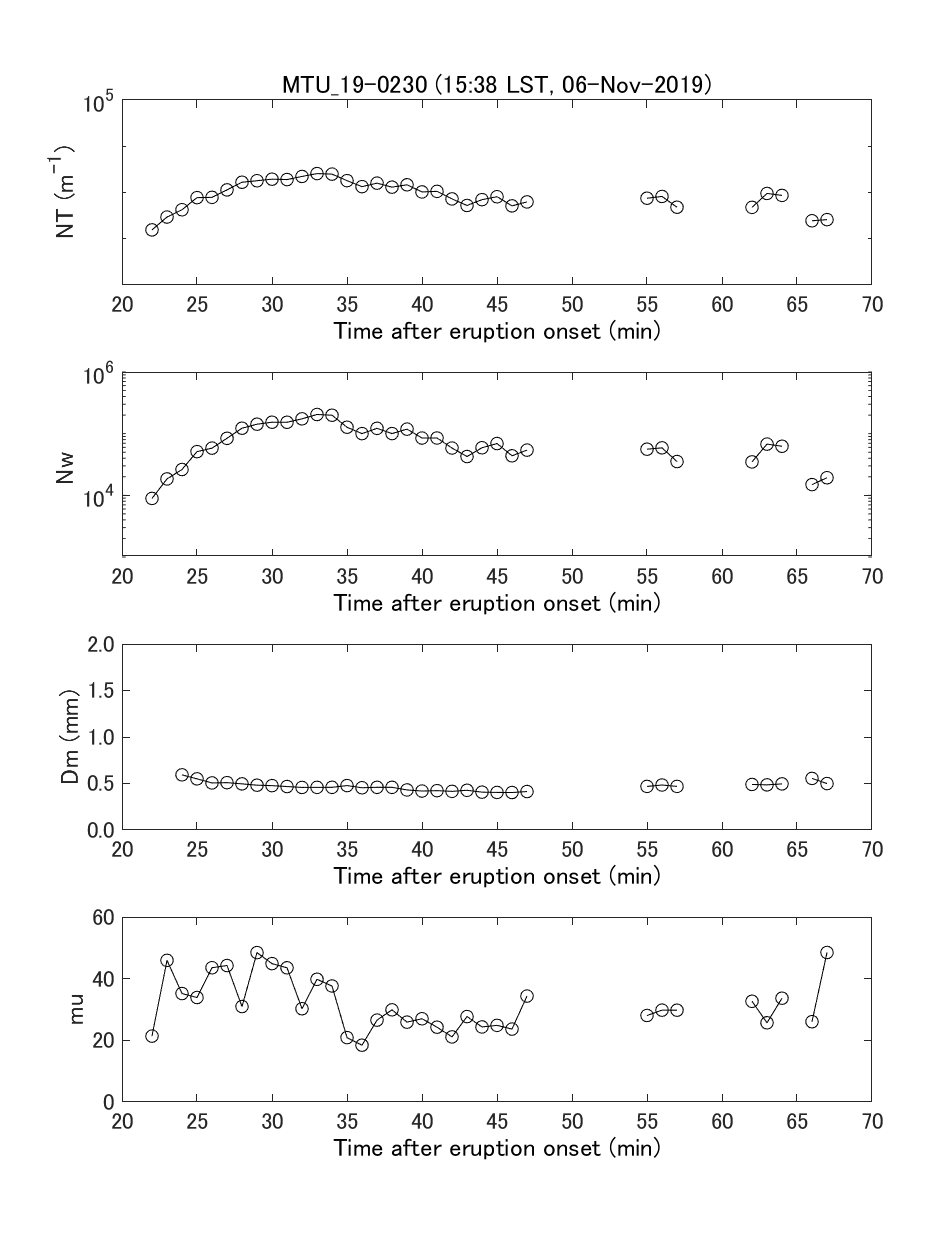
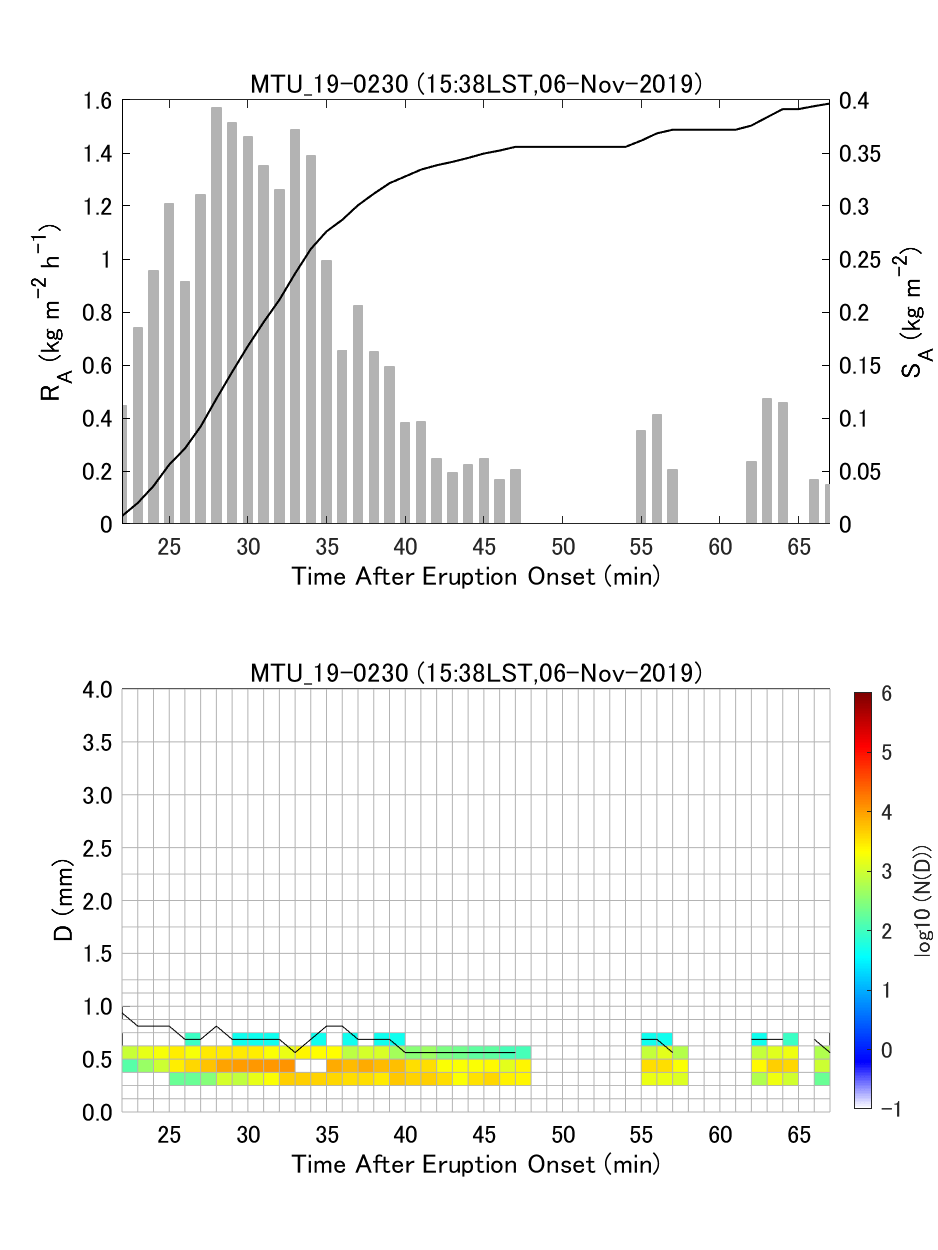
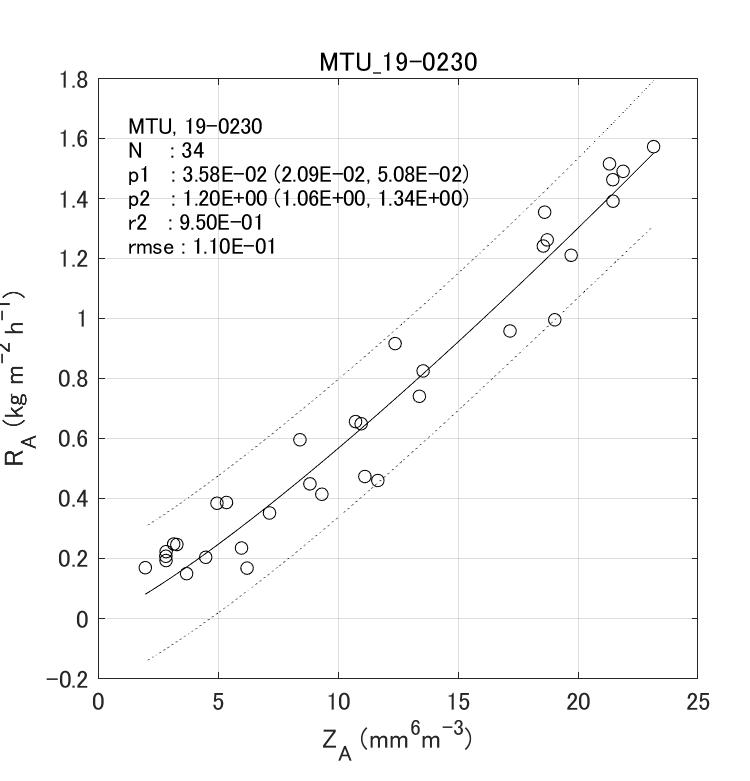
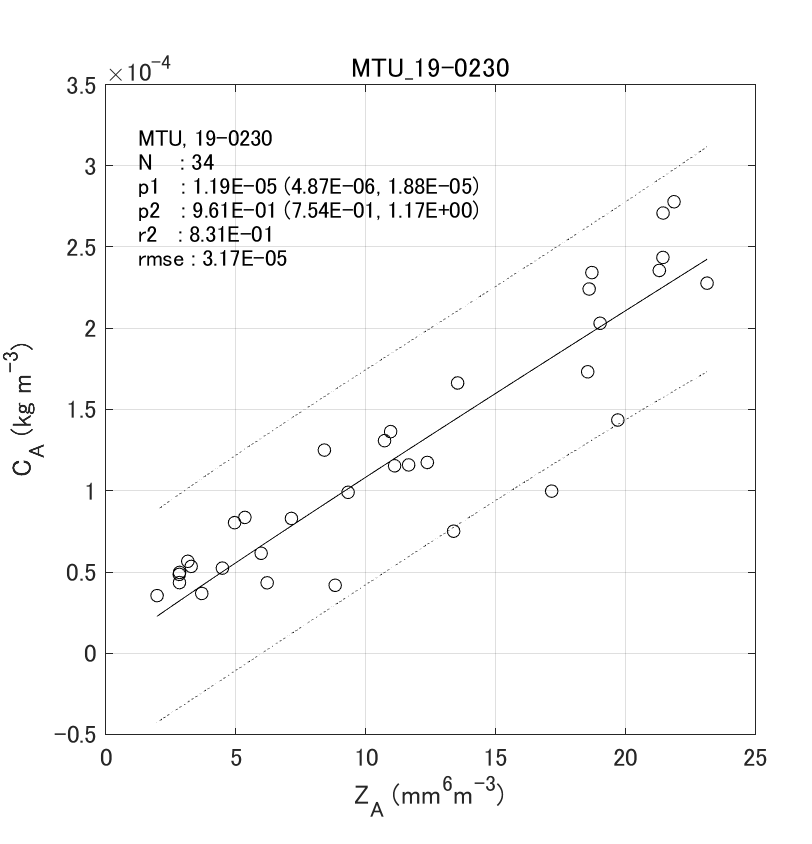
DISDROMETER (DPRI)
![Fig. 6-1 Density plots of the particle size and fall velocity of volcanic ash particles.](https://vash.jp/wp-content/uploads/2023/03/skr19-0230_disdro-01.png)
![Fig. 6-2 Gamma fitting curves of observed particle size distributions.](https://vash.jp/wp-content/uploads/2023/03/skr19-0230_disdro-02.png)
![Fig. 6-3 Temporal change of gamma PSD parameters and integrated PSD parameters.](https://vash.jp/wp-content/uploads/2023/03/skr19-0230_disdro-03.png)
![Fig. 6-4 Temporal change of ash fall rate and PSD.](https://vash.jp/wp-content/uploads/2023/03/skr19-0230_disdro-04.png)
![Fig. 6-5 Histograms of observed gamma PSD parameters.](https://vash.jp/wp-content/uploads/2023/03/skr19-0230_disdro-05.png)
![Fig. 6-6 Histograms of observed normalized gamma PSD parameters.](https://vash.jp/wp-content/uploads/2023/03/skr19-0230_disdro-06.png)
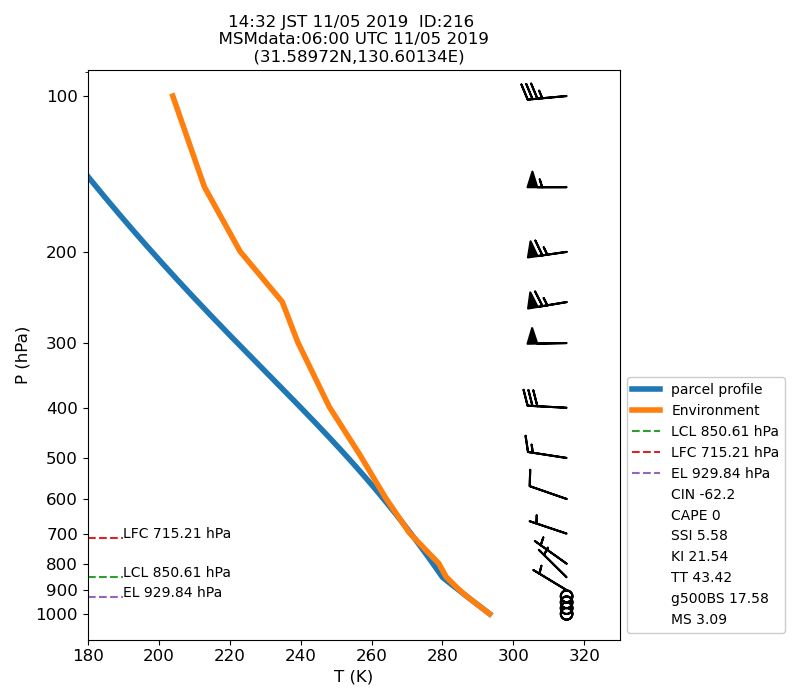
Meteorological Information
![Fig. 7-1 Atmospheric instability in the upper atmosphere shown by the emagram.](https://vash.jp/wp-content/uploads/2024/03/skr19-0230_msm-01.png)